If your NTU readings feel inconsistent, the issue is rarely the water and almost always the workflow. A turbidity meter can produce highly repeatable results, but only when sampling, vial handling, calibration, and timing are treated as part of the measurement. This guide walks you through a practical, step-by-step method you can use in a lab, plant, or field program, with technique details that reduce “mystery spikes” and operator-to-operator variation. We’ll also anchor key points to widely recognized references such as EPA Method 180.1 and ISO 7027-1.
What a turbidity meter measures
A turbidity meter measures how cloudy water is by detecting how suspended particles scatter or reduce light passing through the sample. Most instruments report results in NTU (Nephelometric Turbidity Units) and use nephelometric measurement principles like those described in EPA Method 180.1.
You’ll see “turbidimeter” and “nephelometer” used interchangeably in many settings. ISO 7027-1 describes two quantitative approaches using optical instruments: nephelometry, which is commonly applied to low-turbidity water such as drinking water, and turbidimetry, which is often more suitable for highly turbid waters such as wastewater.
Why your turbidity readings vary more than you expect
Turbidity is unusually sensitive to small handling changes because you’re measuring light interaction with particles that can settle, clump, or trap microbubbles. Two technicians can test “the same” sample and get different values if one shakes aggressively (introducing bubbles) while the other mixes gently. Vial condition matters just as much. Smudges, droplets, and scratches can scatter light and create artificial changes, especially at low NTU where the signal is subtle.
A helpful reality check is visual. The Australian Drinking Water Guidelines note that “crystal-clear” water usually has turbidity less than 1 NTU, while around 5 NTU appears slightly muddy or milky in a glass and above 60 NTU becomes difficult to see through. That’s a wide span of appearances, but your meter is often used to distinguish changes far smaller than what the eye can detect.
When a turbidity meter is most useful in the real world
In drinking-water and treatment operations, turbidity is valued because it can be measured quickly and is widely used for operational monitoring within Water Safety Plan-style control programs described in WHO resources.
In environmental monitoring, turbidity helps quantify storm impacts, sediment disturbance, and plume behavior. In industrial or wastewater applications, it can act as a process indicator that flags clarifier or filtration upsets before other parameters shift.
Before you measure: set yourself up for accurate NTU results
Start by confirming the basics on your instrument. Make sure the units are correct, the sample chamber is clean and dry, and the lid closes properly. Ambient light leakage is a surprisingly common cause of noisy readings.
Next, make sure you have the right standards and a sensible verification routine. EPA Method 180.1 states an applicable range of 0–40 NTU and notes that higher values may be obtained by dilution. That matters because if you routinely measure above that range without diluting, you can push the method beyond where it’s intended to operate.
If your program depends on consistent day-to-day comparability, a “calibrate on schedule, verify daily” approach is often more stable than calibrating constantly. ISO 7027-1 also reinforces that method choice and technique should match the turbidity level and the kind of water being measured.
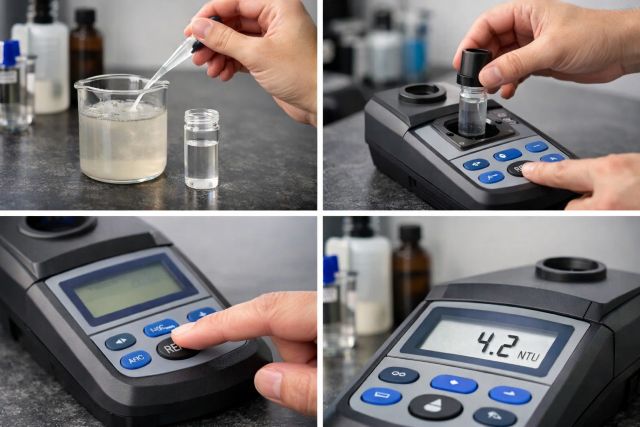
How to use a turbidity meter step-by-step for accurate results
Step 1: Collect a representative sample without introducing bubbles
Use a clean container and collect from a point that represents the water you care about. If you sample from a container that has been sitting, you risk capturing a layer that is clearer than the bulk water because particles settle. If you sample too aggressively, you risk introducing air.
In the field, measure as soon as practical. In the lab, keep the time between collection and measurement consistent. Turbidity can change simply because particles settle or because the sample warms or cools.
Step 2: Mix gently and consistently
Your goal is to re-suspend particles without creating foam. A reliable technique is slow inversion. Do it the same way every time because consistency is what makes your dataset trustworthy. If the sample is very prone to bubbles, let it rest briefly after mixing so fine bubbles can rise.
Step 3: Prepare the vial like it’s part of the instrument
This is the most important skill to master. Many “bad readings” are really “bad vial prep.”
Rinse the vial if your SOP allows, then fill to the intended line. Cap it and inspect the outside under good light. Wipe the exterior with a lint-free cloth. If you see fingerprints, water droplets, or haze, assume it will affect the optics.
Also inspect for scratches. A scratched vial can scatter light in a way that looks like real turbidity, especially at low NTU. If repeatability matters, reserve specific vials for low-turbidity work and retire any that are visibly worn.
Step 4: Remove bubbles before placing the vial in the meter
Hold the vial up and look for tiny bubbles clinging to the inner wall. If you see them, don’t “hope for the best.” Tap gently or let the vial rest briefly. If the sample was poured too vigorously, you may need to refill more gently.
This one step is often the difference between stable readings and frustrating variability.
Step 5: Calibrate or verify calibration using appropriate standards
Follow your instrument’s calibration procedure and match your standards to the range you actually measure. EPA Method 180.1 describes nephelometric measurement and emphasizes an applicable range of 0–40 NTU, with dilution used for higher values.
In many routine programs, operators do a quick calibration verification with a known standard at the start of a shift or sampling day. This is especially helpful in drinking-water monitoring where changes can be small but operationally meaningful. WHO-linked resources describe turbidity as a fast, practical operational parameter in Water Safety Plan approaches to drinking-water quality management.
Step 6: Insert the vial correctly and control orientation
Place the vial into the chamber gently and close the lid fully. If your meter supports vial indexing or has an orientation mark, use it consistently. Even minor differences in vial orientation can change how scratches or tiny imperfections interact with the instrument’s light path.
If your instrument provides an averaging or stabilization option, use it consistently as well. In low NTU ranges, a few seconds of stabilization can reduce noise.
Step 7: Measure, repeat if needed, and document like a professional
Take your reading and record it with context. At minimum, keep the sample ID, location, time, operator, instrument ID, and any notes about dilution, unusual color, bubbles, or handling issues.
If the value is critical, run a second measurement after reinserting the vial in the same orientation. If results disagree more than your program tolerates, assume the vial or sample prep is the issue and re-prepare the vial rather than averaging two questionable numbers.
Step 8: Dilute correctly when turbidity is high
When turbidity exceeds the intended method range, dilution is the standard solution. EPA Method 180.1 explicitly notes that higher values may be obtained with dilution of the sample.
A common dilution approach is to dilute with turbidity-free water (or your program’s specified diluent), measure the diluted sample, then multiply by the dilution factor. The key is to mix gently and measure promptly, because settling happens faster in some high-solids samples.
Interpreting turbidity results without overreacting
Turbidity is most powerful when you watch trends. A single reading can be misleading if the vial was smudged or the sample had bubbles. A consistent upward trend, verified with good technique and a passing standard check, is usually a real signal.
It also helps to calibrate your expectations. The Australian Drinking Water Guidelines provide an intuitive reference for what different NTU values look like, noting that less than 1 NTU is typically crystal-clear and around 5 NTU looks slightly milky.
In drinking-water treatment contexts, the practical value is operational. WHO resources highlight turbidity’s usefulness for rapid monitoring of control measures within Water Safety Plan frameworks, which are designed to keep water quality under control from source to consumer.
Real-world scenarios that show how the method prevents bad decisions
Imagine you’re monitoring finished water and your readings creep from 0.2 NTU to 0.8 NTU over a few hours. If you don’t trust your technique, you might waste time recalibrating repeatedly or, worse, ignore a real process issue. A better response is to verify with a known standard, re-read with a freshly wiped vial, and confirm the trend is real. Once you’ve confirmed the measurement integrity, you can investigate filtration performance, coagulant dosing, or raw water shifts.
Now consider a storm-event creek sample that reads above the method’s practical window. If you record an off-scale number or treat the first reading as “truth,” your dataset becomes hard to compare across events. Using dilution aligns with the approach described in EPA 180.1, helps the instrument work in its intended range, and produces a defensible result.
FAQ about turbidity meters
What is a turbidity meter used for?
A turbidity meter is used to measure water clarity by quantifying light scattering from suspended particles, typically reporting the result in NTU for operational control, compliance monitoring, or environmental assessment.
How often should I calibrate a turbidity meter?
Calibration frequency depends on your QA plan, instrument stability, and how critical the data is. Many programs calibrate on a schedule and verify daily with a known standard so they can detect drift early and keep results comparable over time.
Why are my turbidity readings higher than expected?
The most common reasons are microbubbles, fingerprints or droplets on the vial, scratches on the vial, dirty optics, or a calibration/verification failure. Correct vial handling and a standard check usually pinpoint the cause quickly.
What’s the difference between ISO 7027-1 and EPA Method 180.1?
EPA Method 180.1 describes nephelometric turbidity measurement and specifies an applicable range of 0–40 NTU with dilution used for higher values. ISO 7027-1 describes two quantitative approaches and notes nephelometry is often applied to low-turbidity water while turbidimetry is more applicable to highly turbid water.
Conclusion: consistent technique is the secret to reliable turbidity meter data
A turbidity meter is only as accurate as the technique around it. If you collect carefully, mix gently, remove bubbles, treat the vial like part of the optics, and verify calibration routinely, you’ll get stable NTU results that hold up in audits and in real operational decisions. Aligning your workflow with recognized references like EPA Method 180.1 and the method concepts described in ISO 7027-1 helps ensure your numbers are both repeatable and defensible, whether you’re tracking filtration performance, monitoring a source during storms, or documenting compliance data.


Leave a comment